The high emissions scenarios that underpinned climate risk reports are being superseded.
The Shared Socioeconomic Pathways that carried the Sixth Assessment Report are giving way to a new set built for CMIP7, the seventh round of the modelling exercise that supplies the IPCC with its projections, and the Seventh Assessment Report will run on them. If you have signed off a tailings facility under the Global Industry Standard on Tailings Management, filed a TCFD or IFRS S2 disclosure, or commissioned a water resources plan in the past five years, this is the machinery underneath it.
The framework is now published but the model runs will take some time. CMIP7 outputs will arrive over the next year or two, and the downscaled, bias-corrected products that practitioners actually analyse for a project will lag behind that by longer still. So the position for anyone commissioning climate work in 2026 or 2027 is an awkward one: you will be handed CMIP6, and the high emission scenarios underneath it have already been written off in the literature.
SSP5-8.5, an extreme storyline requiring a civilisational sprint back towards coal, is now gone. It was retired in print by the group that produces the scenarios. ScenarioMIP states that the CMIP6 high emission levels quantified by SSP5-8.5 have become implausible, on the evidence of renewable costs, the emergence of climate policy and observed emissions.
SSP3-7.0 has no successor either. CMIP7 declined to carry anything at that level, and its new High scenario sits below SSP3-7.0 on both cumulative emissions and forcing. That matters more than the loss of 8.5, because SSP3-7.0 is the scenario sitting inside most of the climate risk assessments written in the past years.
For a decade those two were treated as the conservative choice. They are embedded in national climate assessments, in climate stress tests, and in the default settings of the data portals most of us download from. Risk averse asset owners kept them because they looked prudent. Liability averse advisers kept them because nobody was ever criticised for assuming the worst.
A generation of risk assessments ended up biased high by fear and convenience, not by science.
The SSP naming convention did make it easy to understand the scenarios. If you have ever tried explaining SSP3-7.0 to an asset owner, you will know the problem. The label carries a socioeconomic storyline and a radiative forcing target, and neither is something anyone in that room can act on. Both of us end up nodding at a string of characters that answers no question either of us came to ask.
The new names are no better than the old ones
The Shared Socioeconomic Pathways came with narrative titles: Sustainability: Taking the Green Road for SSP1, Regional Rivalry: A Rocky Road for SSP3, Fossil-fuelled Development: Taking the Highway for SSP5. Attached to each was a number and the radiative forcing in watts per square metre by 2100, which meant nothing to anyone signing off a capital programme, multi million investment or government policy.
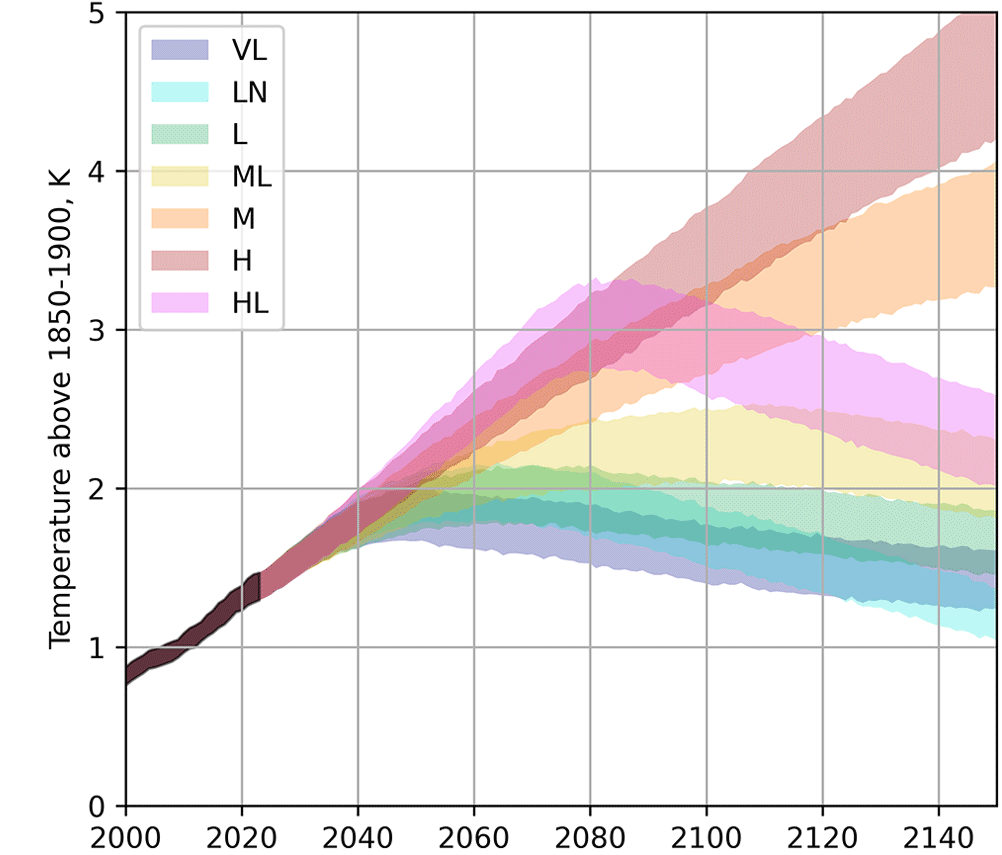
The new scenario set for CMIP7 abandons both the socioeconomic storytelling and the forcing numbers. Seven scenarios now run from High (H) through High-to-Low (HL), Medium (M), Medium-to-Low (ML), Low (L) and Low-to-Negative (LN) down to Very Low (VL). The Medium scenario is anchored to current policies whereas the High scenario represents an actual rollback of climate policy rather than an implausible coal renaissance.
But the same problem continues and the new names are not informative. “Medium-to-Low” tells a reservoir owner nothing about what to design for. We have traded colourful nonsense for bureaucratic beige, and the fundamental communication problem, translating a global emissions storyline into a local design decision, remains exactly where it was. Better to keep the Figure below handy in case the conversation about new scenarios starts.
And yet the sceptic in me is obliged to report genuine progress. CMIP7 makes emissions-driven simulation the default rather than a specialist side experiment. CMIP6 ran a handful of these, but in CMIP7 most scenarios are intended to run that way, which lets the carbon cycle respond interactively rather than being prescribed.
Kilometre-scale modelling is arriving too, and convection, the engine of the storms that matter to us hydrologists, is beginning to be resolved rather than parameterised. However, be careful where you expect to find it. The CMIP7 core ensemble will run at much the same grid spacing as CMIP6, 100 km to 200 km in the atmosphere. The high resolution subset reaches 25 km whereas kilometre-scale work is happening largely outside CMIP altogether.
It matters less than you think
A general circulation model is a magnificent physics machine for simulating the planet’s energy balance. It does temperature well. On the variable water professionals care about most, rainfall, it is far less reliable.
I have yet to see a chart showing the 35 models in the NASA NEX-GDDP-CMIP6 set agreeing on the sign of a rainfall trend for a catchment, a coastline or an island. Surely such a chart exists somewhere. On the projects I have worked on, they have been unicorns. Not talking about the agreement on magnitude and intensity, but agreement on whether the place gets more rain or less between now and the end of the century.
Precipitation in a GCM is largely parameterised, meaning approximated by simplified rules, because the grid cells are too coarse to resolve the convective storms that flood your catchment. Tropical cyclones are worse. A CMIP-class model will produce something cyclone-shaped in roughly the right ocean basin, and that is it. Intensity is often badly underestimated, rapid intensification does not happen at all, and the inner core of the cyclone that does the damage is much smaller than a grid cell. The model can tell you a storm passed but it can rarely tell you what fell on your site.
Extreme sub-daily rainfall as a key design input, orographic effects, the behaviour of a single river basin: all of it lives below the model’s eyesight.
None of this is a secret. It is stated plainly in the technical literature. Yet the modern workflow often looks like this: download CMIP output, extract daily rainfall for the grid cell covering the project site, fit a distribution, produce a design storm to two decimal places, and present it with a straight face. The dataset is enormous, therefore it must be authoritative. We became brilliant at handling large climate datasets and rather worse at asking what they represent.
A GCM rainfall series is not a rain gauge. It is a model’s opinion, expressed in millimetres.
Scenarios compound the problem, because they are not forecasts. No probabilities are attached to them. Choosing between them is a judgement about policy futures, not a statistical exercise, and yet they are routinely averaged, blended and percentile-ranked as though they were an ensemble of equally likely weather forecasts. Hence every analysis covers everything, with no critical interpretation and no clear way forward.
A small Caribbean island or any small island state is a good example. The wind piles up against the mountains on one side and dumps its rain there. Drive 30 minutes over the ridge and you are close to semi-arid. One island, two hydrologies, separated by a ridge line. The dominant flood mechanism is not a small shift in mean rainfall but the passage of hurricanes or storms whose tracks decide in a matter of hours which valleys flood and which stay dry.
Now place a GCM grid cell over that island. At typical CMIP resolution, the pixel is 90 per cent ocean or more. The island does not exist to the model. Whatever “projected rainfall change” you extract from that cell is a statement about a patch of tropical sea surface with a small crumb of land. Running scenario comparisons under those conditions is not informative. The answer is that the projection has nothing local to say, and pretending otherwise is how reports with fancy charts get written with no meaning behind them.
Where the climate signal actually lives
If climate change is affecting your catchment, the evidence is not sitting in a CMIP6 or CMIP7 ensemble. It is sitting in your historical rainfall record. Trends, shifting seasonality, changing storm intensity, non-stationarity in the extremes: these are detected in observed data, with statistics.
The work is unglamorous and sometimes very tedious. It involves quality control, homogeneity and stationarity testing and honest treatment of short records, and it will never look as impressive as a seven-scenario ensemble dashboard. But rigorous data analysis beats fancy manipulation of GCM output every single time.
The one thing the observed record cannot do is speak to futures outside anything yet experienced, and that is the legitimate job of the models. A projection tells you what a model thinks might happen but your rain gauges tell you what is actually happening.
What to do instead
First, understand your baseline hydrology before touching a projection; if your flood frequency analysis is built on 12 years of patchy gauge data, the choice between scenario M and ML is not your biggest uncertainty. And if you do use a projection, apply the range of change factors to your observed record rather than adopting a model’s rainfall series as rainfall.
Second, treat scenarios as climate stress tests, not predictions. A design question should be phrased as “does this asset survive plausible future X?”, never as “what will rainfall be in 2060?”.
Third, ask what the dataset in front of you is actually made of. Which model, at what grid spacing, downscaled how, bias-corrected against which observations and baseline period. If the report cannot answer that, the numbers in it are decorative.
And finally, be willing to conclude that the projection has nothing to say. If the grid cell your climate change data comes from is mostly ocean, or represents atmospheric conditions unlike those at your site, then the correct professional conclusion is that the projection is not informative at this location. Nothing in the standards requires a projection to become a design number; that judgement belongs to the engineer. And nobody was ever sued for saying what the data could not support.
References
- van Vuuren, D. et al. (2026). The Scenario Model Intercomparison Project for CMIP7. Geoscientific Model Development, 19, 2627. doi.org/10.5194/gmd-19-2627-2026
- Dingley, B. et al. (2026). Guest post: How CMIP7 will shape the next wave of climate science. Carbon Brief, 22 May 2026.
- Pielke Jr, R., Burgess, M. G. and Ritchie, J. (2022). Plausible 2005-2050 emissions scenarios project between 2 °C and 3 °C of warming by 2100. Environmental Research Letters, 17, 024027. doi.org/10.1088/1748-9326/ac4ebf